
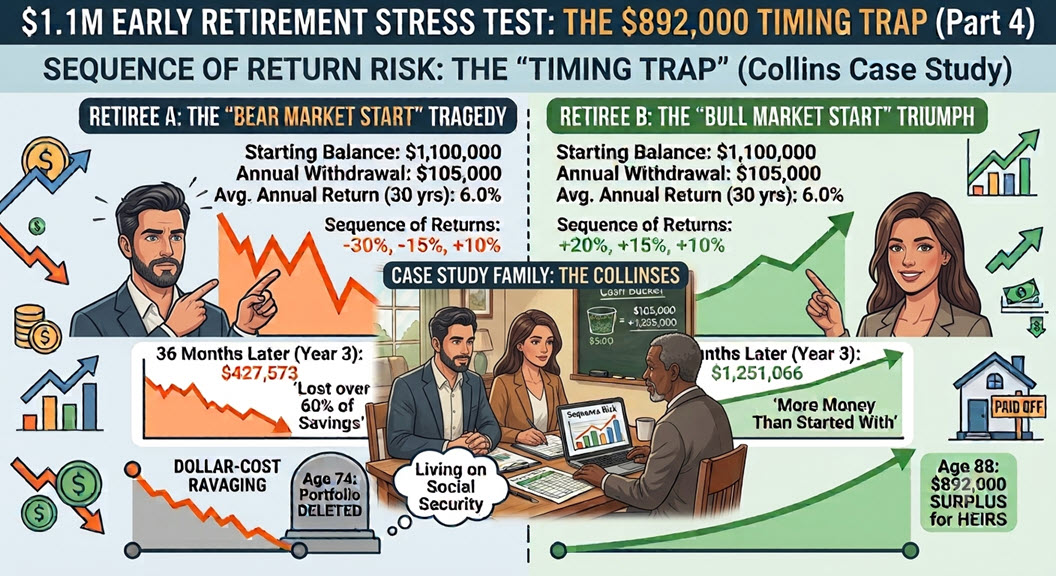
What happens when two retirees experience the exact same 6% average market return, but one goes completely broke while the other dies a millionaire? Welcome to Sequence of Return Risk.
📌 THE COLLINS FAMILY CASE STUDY
Welcome back to our 10-week early retirement masterclass right here on Retirementrus.com! We are following Henry (55) and Rachel (50) as they engineer a blueprint to retire at 58 with $1.1 million and a paid-off home.
In Part 1, we mapped their balance sheet and California tax overhead.
In Part 2, we debunked the 4% Rule and explored the “Two-Phase” asymmetric retirement.
In Part 3, we ran 10,000 Monte Carlo simulations to prove their portfolio could survive historical market crashes.
Today, we are zooming in on the single greatest wealth-destroyer in early retirement. It isn’t inflation. It isn’t taxes. It is a mathematical anomaly known as Sequence of Return Risk.
The Illusion of “Average” Returns
If you have ever met with a traditional financial advisor, you have probably been shown a spreadsheet that assumes your portfolio will grow by a steady 6%, 7%, or 8% every single year.
During your working years, this assumption is mostly fine. When you are accumulating wealth and contributing a portion of your paycheck every two weeks, you actually benefit from market crashes. When the market drops, your bi-weekly 401(k) contributions simply buy more shares at a steep discount. This is known as dollar-cost averaging.
But the moment you retire, the math flips upside down.
When you transition from accumulating wealth to withdrawing wealth, you are subjected to dollar-cost ravaging. If you are forced to sell off shares of your portfolio to pay for groceries, property taxes, and health insurance while the stock market is down 20%, those shares are permanently destroyed. They will never be there to capture the recovery when the next bull market arrives. You are, quite literally, eating your seed corn.
Because of this dynamic, the average return of your portfolio over 30 years doesn’t matter nearly as much as the exact order in which those returns arrive.
Retiree A vs. Retiree B: A Financial Tragedy
To prove how devastating Sequence of Return Risk (SoRR) can be, let’s look at a mathematical case study. We are going to compare two hypothetical retirees: Retiree A and Retiree B.
Both retirees have built the exact same financial foundation as Henry and Rachel Collins:
-
Starting Portfolio Balance: $1,100,000
-
Annual Withdrawal Rate: $105,000 (adjusted 3% annually for inflation)
-
Average Annual Return: Exactly 6.0% over 30 years.
Both retirees experience the exact same 30-year average return. However, the sequence of those returns is completely reversed.
The Market Environments
-
Retiree A (The Unlucky Start): Retires on the eve of a massive financial crisis. Their portfolio drops 30% in Year 1, drops another 15% in Year 2, and then slowly recovers with a 10% gain in Year 3. After that, they experience a long, steady bull market.
-
Retiree B (The Lucky Start): Retires into a roaring bull market. Their portfolio surges 20% in Year 1, jumps another 15% in Year 2, and climbs 10% in Year 3. They experience their bear markets much later in life.
Let’s look at what happens to their actual account balances.
The First Three Years: The Divergence
Watch how quickly the math spirals out of control when you mix severe market losses with heavy portfolio withdrawals.
Retiree A (Bear Market Start)
-
Start: $1,100,000
-
Year 1: Withdraws $105,000. The remaining balance suffers a -30% market crash. End of Year 1 Balance: $696,500.
-
Year 2: Withdraws $108,150 (inflation-adjusted). The remaining balance suffers a -15% market drop. End of Year 2 Balance: $500,097.
-
Year 3: Withdraws $111,394. The remaining balance finally catches a +10% market gain. End of Year 3 Balance: $427,573.
In just 36 months, Retiree A has lost over 60% of their life savings.
Retiree B (Bull Market Start)
-
Start: $1,100,000
-
Year 1: Withdraws $105,000. The remaining balance enjoys a +20% market surge. End of Year 1 Balance: $1,194,000.
-
Year 2: Withdraws $108,150. The remaining balance enjoys a +15% market surge. End of Year 2 Balance: $1,248,727.
-
Year 3: Withdraws $111,394. The remaining balance enjoys a +10% market gain. End of Year 3 Balance: $1,251,066.
In 36 months, despite pulling out over $324,000 to live on, Retiree B has more money than they started with.
The 30-Year Outcome: The $892,000 Gap
Even though Retiree A experiences decades of fantastic stock market returns later in life, it does not matter. The damage to the principal was too severe, too early. There simply weren’t enough shares left to capture the compounding growth.
-
Retiree A’s Fate: The portfolio is completely, mathematically depleted by age 74. They are forced to live exclusively on Social Security for the rest of their lives.
-
Retiree B’s Fate: The portfolio easily survives all future bear markets because the early growth created an impenetrable compounding cushion. Retiree B passes away at age 88 with a massive surplus of $892,000 to leave to their heirs.
This is the ultimate paradox of retirement math. You can do everything right, save $1.1 million, average a 6% return over your retirement, and still end up destitute simply because you retired in the wrong calendar year.
The Collins Family Defense: The Cash Bucket Strategy
Henry Collins cannot predict what the stock market will do on the day he retires at 58. If he hits a Year 1 bear market, a 9.55% withdrawal rate will send him straight down the path of Retiree A.
To guarantee this doesn’t happen, Henry and Rachel must implement a Cash Bucket Strategy.
If you look back at their balance sheet from Part 1, you’ll notice a critical detail: they hold $250,000 in liquid cash and money market funds. This is not an accident—it is a specialized defensive shield.
At $105,000 per year in spending, their $250,000 cash reserve represents roughly 2.5 years of living expenses.
If Henry retires at 58 and the stock market immediately drops 30%, Henry will not panic. More importantly, he will not sell a single share of his stock portfolio. Instead, Henry and Rachel will turn off their equity dividends and fund 100% of their living expenses directly from their cash reserves.
Historically, the average bear market lasts between 14 and 18 months, with a full recovery typically occurring within three years. By holding 2.5 years of cash, the Collins family buys their stock portfolio the one asset it desperately needs to recover: Time.
By avoiding forced liquidations during red years, Henry and Rachel effectively neutralize Sequence of Return Risk, ensuring their capital base remains intact to compound for the next three decades.
Coming Up Next Week in Part 5… Now that we have protected the portfolio from market crashes, we have to tackle the biggest fixed cost in early retirement: Health Insurance.
Retiring at 58 means the Collins family must bridge 7 agonizing years until Medicare kicks in at age 65. Next week, we are going to show you how a seemingly minor shift in where they pull their cash from will manipulate their tax bracket and unlock massive Affordable Care Act (ACA) subsidies—saving them over $28,000 per year in overhead costs.
Important Disclosures: Retirement “R” Us, a registered retirement planning advisor, provides this information for educational purposes only. It is not intended to offer personalized investment advice or suggest that any discussed securities or services are suitable for any specific investor. Readers should not rely solely on the information provided here when making investment decisions.
- Investing carries risks, including the potential loss of principal. No investment strategy can ensure a profit or protect against loss during market downturns.
- Past performance is not indicative of future results.
- The opinions shared are not meant to serve as investment advice or to predict future performance.
- While we believe the information provided is reliable, we do not guarantee its accuracy or completeness.
- This content is for educational purposes only and is not intended as personalized advice or a guarantee of achieving specific results. Consult your tax and financial advisors before implementing any discussed strategies.
- Everyone’s retirement circumstances, especially when it comes to health insurance and health care, are unique.
- Retirement “R” Us does not provide tax or legal advice. Please consult your tax advisor or attorney for advice tailored to your situation.
Legal Disclaimer: The information provided on this website is for general informational purposes only and is not intended to be legal advice. While we strive to ensure the accuracy and completeness of the information, we make no guarantees regarding its accuracy, completeness, or timeliness. The content is provided “as is” without any warranties of any kind, either express or implied.
Use of this website does not create an attorney-client relationship between the user and the website owner or any of its contributors. Users should not act upon the information provided without seeking professional legal counsel. Any reliance on the information provided is solely at the user’s own risk.
We are not responsible for any errors or omissions, or for any actions taken based on the information provided on this website. Links to third-party websites are provided for convenience only and do not constitute an endorsement or approval of their content. We are not liable for any damages arising from the use of or reliance on the information provided on this website or any linked third-party websites.
By using this website, you agree to the terms of this legal disclaimer. If you do not agree with these terms, please do not use this website.
Leave a Reply