
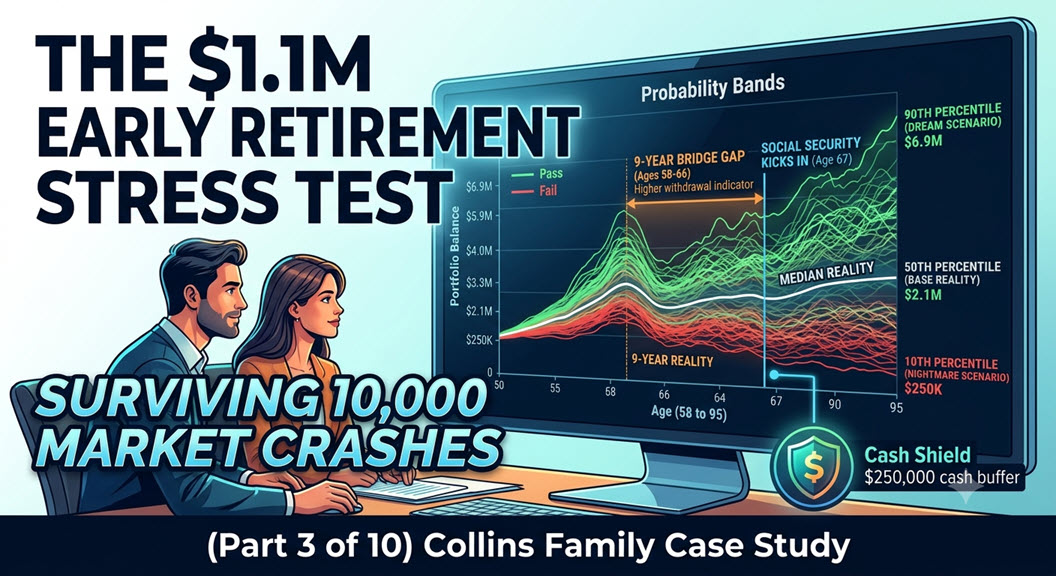
What happens if the stock market plummets the day after you retire? We abandon the fantasy of “average returns” and run the Collins family’s $1.1 million portfolio through a 10,000-scenario Monte Carlo simulation.
📌 THE COLLINS FAMILY CASE STUDY ON RETIREMENT R US
Welcome back to our 10-week early retirement masterclass! We are following Henry (55) and Rachel (50) as they build a blueprint to retire at 58 with $1.1 million and a paid-off home.
In Part 1, we reviewed their [balance sheet and California tax overhead].
In Part 2, we debunked the 4% Rule, revealing that their scary 9.55% initial withdrawal rate actually drops to a highly safe 3.41% once Social Security kicks in at age 67.
Now that we know they only need to survive a 9-year “bridge period,” we have to ask the most terrifying question in finance: What if the market crashes on day one?
The Fatal Flaw of “Average” Returns
When most people build a retirement plan, they open a spreadsheet, input their starting balance, plug in a steady 7% or 8% annual return, and drag the formula down for 30 years. Financial planners call this a deterministic model.
Deterministic models are comforting, but they are also deeply dangerous.
There is an old statistics joke: A mathematician drowned crossing a river that had an average depth of three feet. The same logic applies to retirement planning. The stock market might average a 7% to 10% return over a century, but it almost never delivers exactly 7% in any given 12-month period. It might return +22% one year, -18% the next, and +4% the year after.
When you are accumulating wealth during your working years, this volatility doesn’t matter much. But when you are withdrawing wealth to pay for groceries, healthcare, and property taxes, volatility becomes the single greatest threat to your financial survival. If you are forced to sell off shares of your portfolio while the market is down 20%, those shares are permanently gone. They cannot capture the recovery.
To prove whether Henry and Rachel can safely execute their 9.55% bridge withdrawal, we must throw out the static spreadsheet. Instead, we are going to stress-test their lives using the gold standard of financial modeling.
Enter the Monte Carlo Simulation
A Monte Carlo simulation is a computerized mathematical technique that allows professionals to account for risk in quantitative analysis and decision-making. Named after the famous casino in Monaco, the simulation recognizes that the future is a game of probability, not certainty.
Instead of projecting one straight line into the future, a Monte Carlo simulation runs the Collins family’s exact financial profile through 10,000 different randomized lifetimes.
The algorithm scrambles historical market data. In some lifetimes, Henry and Rachel retire into a massive, roaring 1990s-style bull market. In other lifetimes, they retire right into the teeth of a 2008-style financial crisis, followed immediately by 1970s-style inflation spikes. The simulation factors in:
-
Standard Deviation (Volatility): How wildly the asset classes swing from year to year.
-
Inflation Shocks: Randomized spikes in the cost of living.
-
Sequence of Returns: The exact order in which the good and bad years arrive.
By running 10,000 parallel universes, we don’t get a binary “pass or fail.” We get Probability Bands—a statistical map showing us the best-case, worst-case, and most likely scenarios.
The Collins Family Simulation Parameters
Before we reveal the results, let’s lock in the exact data points the algorithm is using for Henry and Rachel’s test:
-
Starting Investable Assets: $1,100,000
-
Asset Allocation: 60% Global Equities / 40% Fixed Income & Cash Equivalents. (Crucially, they are holding $250,000 in highly liquid cash/money market funds).
-
Phase 1 Spending (Ages 58–66): $105,000 per year (This is their 9-year “Bridge Gap”).
-
Phase 2 Spending (Ages 67–95): $37,500 net portfolio draw per year (After $67,500 in Social Security begins).
-
Inflation Assumption: 3.0% baseline, randomized annually.
-
Time Horizon: 37 Years (Funding Henry from age 58 to age 95).
The Results: The Probability Bands
After subjecting their portfolio to 10,000 grueling lifetimes, here is exactly how much money Henry and Rachel will have left at age 95 across the probability spectrum.
| Percentile Outcome | Portfolio Balance at Age 95 | The Real-World Market Environment |
| 90th Percentile | $6,900,000 | The Dream Scenario: They retire into a prolonged, historic bull market. Compounding growth massively outpaces their early bridge withdrawals. |
| 80th Percentile | $4,400,000 | Strong Growth: Above-average market returns. Early distributions are easily absorbed by steady equity appreciation. |
| 50th (Median) | $2,100,000 | The Base Reality: Historical average market performance. Their net wealth nearly doubles over 37 years despite high early draws. |
| 20th Percentile | $620,000 | Underperforming: Below-average market returns during the early decade. The portfolio takes a hit but stabilizes permanently once Social Security starts. |
| 10th Percentile | $250,000 | The Nightmare Scenario: A severe, multi-year bear market strikes the exact day Henry retires. Maximum financial stress. |
Deep Dive: Decoding the Data
How is it mathematically possible that a couple pulling $105,000 a year from a $1.1M portfolio survives 90% of all historical market conditions? Let’s break down the mechanics.
1. The Median Reality ($2.1 Million)
In the 50th percentile—the most likely outcome based on historical averages—Henry and Rachel die with nearly twice as much money as they retired with. This perfectly illustrates the power of the Asymmetric Two-Phase Retirement we discussed in Part 2. Because their heavy 9.55% draw only lasts for 9 years, the portfolio is never permanently drained. Once Social Security acts as a massive relief valve at age 67, the portfolio’s growth engine kicks back into high gear, compounding their remaining capital for the next 28 years.
2. The Nightmare Scenario ($250,000)
The 10th percentile represents a devastating early market crash. Equities plummet right as Henry steps away from his $150,000 salary. In a traditional 100% stock portfolio, this would be an unmitigated disaster—they would be forced to sell off massive chunks of their tanking portfolio just to buy groceries, destroying their capital base.
So why didn’t they go broke?
Look back at their balance sheet from Part 1. Henry and Rachel hold $250,000 in liquid cash and money market funds.
When the Monte Carlo simulation throws a bear market at them in Year 1, Year 2, and Year 3, their financial plan is designed to leave their stock portfolio completely alone. Instead of selling depressed equities, they draw their $105,000 living expenses directly from their cash buffer. This cash shield gives their stock portfolio the time it needs to recover. By the time the cash runs out, the bear market has ended, and their equities have bounced back.
This specific survival mechanism is how you neutralize the ultimate retirement killer: Sequence of Return Risk.
Coming Up Next Week in Part 4…
We have mentioned “Sequence of Return Risk” several times, but next week, we are dedicating an entire post to it. We will compare two retirees who experience the exact same 6% average market return over 30 years—but because of the timing of those returns, one dies with $900,000 in the bank, and the other goes completely broke at age 74.
You will not want to miss the $892,000 timing trap.
Important Disclosures: Retirement “R” Us, a registered retirement planning advisor, provides this information for educational purposes only. It is not intended to offer personalized investment advice or suggest that any discussed securities or services are suitable for any specific investor. Readers should not rely solely on the information provided here when making investment decisions.
- Investing carries risks, including the potential loss of principal. No investment strategy can ensure a profit or protect against loss during market downturns.
- Past performance is not indicative of future results.
- The opinions shared are not meant to serve as investment advice or to predict future performance.
- While we believe the information provided is reliable, we do not guarantee its accuracy or completeness.
- This content is for educational purposes only and is not intended as personalized advice or a guarantee of achieving specific results. Consult your tax and financial advisors before implementing any discussed strategies.
- Everyone’s retirement circumstances, especially when it comes to health insurance and health care, are unique.
- Retirement “R” Us does not provide tax or legal advice. Please consult your tax advisor or attorney for advice tailored to your situation.
Legal Disclaimer: The information provided on this website is for general informational purposes only and is not intended to be legal advice. While we strive to ensure the accuracy and completeness of the information, we make no guarantees regarding its accuracy, completeness, or timeliness. The content is provided “as is” without any warranties of any kind, either express or implied.
Use of this website does not create an attorney-client relationship between the user and the website owner or any of its contributors. Users should not act upon the information provided without seeking professional legal counsel. Any reliance on the information provided is solely at the user’s own risk.
We are not responsible for any errors or omissions, or for any actions taken based on the information provided on this website. Links to third-party websites are provided for convenience only and do not constitute an endorsement or approval of their content. We are not liable for any damages arising from the use of or reliance on the information provided on this website or any linked third-party websites.
By using this website, you agree to the terms of this legal disclaimer. If you do not agree with these terms, please do not use this website.
Leave a Reply