
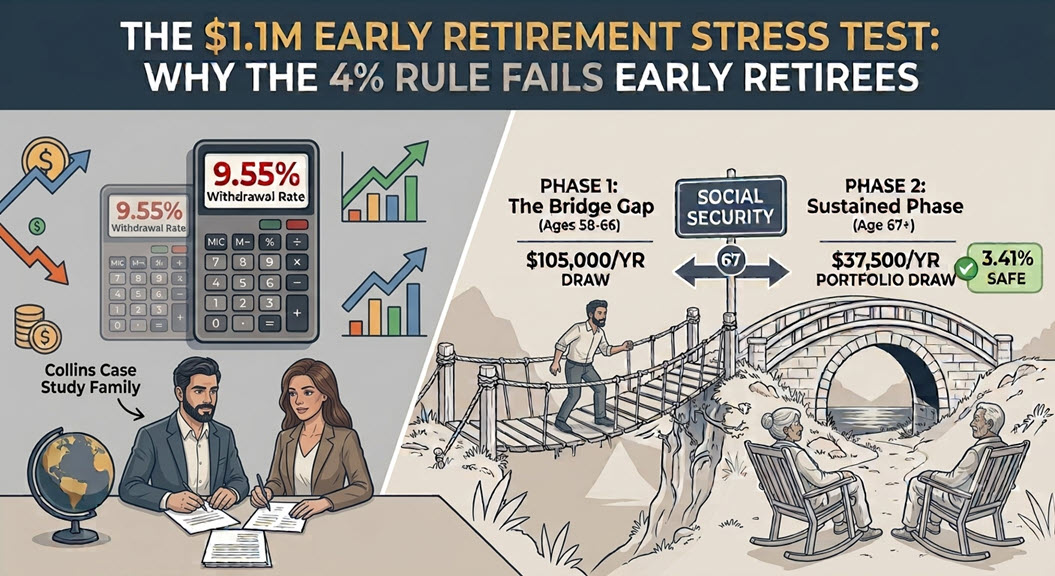
Is a 9.55% initial withdrawal rate a guaranteed path to going broke? We dismantle traditional retirement math to reveal why standard calculators misdiagnose asymmetric cash flows.
📌 THE COLLINS FAMILY CASE STUDY ON RETIREMENT R US
Welcome back to the ultimate early retirement breakdown on Retirementrus.com! Over 10 weeks, we are mapping a comprehensive retirement plan for Henry (55) and Rachel (50), a couple trying to turn $1.1 million into a lifetime income stream starting at age 58.
If you missed the initial balance sheet breakdown, catch up on [Part 1: The $1.1M Baseline].
The 9.55% Math Dilemma
When Henry Collins plugs his family’s $105,000 target spending into standard online retirement calculators against their $1,100,000 liquid portfolio, the resulting math is terrifying.
To generate the required living cash without any outside earned income, their portfolio requires an initial distribution rate calculated as follows:
A 9.55% withdrawal rate immediately triggers failure warnings on almost every piece of financial software. Standard static forecasting models project that pulling nearly 10% annually from a balanced portfolio will exhaust their entire liquid life savings in under 14 years. This projection leaves Henry and Rachel completely broke by age 72.
To understand why this generic calculation creates a false alarm, we must examine the fundamental flaws hidden inside traditional withdrawal benchmarks.
The Origins of the 4% Rule (And Why It Doesn’t Apply Here)
To understand retirement safety, most investors lean on the traditional “4% Rule.” Financial adviser William Bengen invented this 4% withdrawal baseline for retirement planning in 1994[cite: 4, 5].
Bengen ran empirical simulations of historical market behavior to find a maximum safe historical withdrawal rate, concluding that an investor could withdraw up to 4% initially and adjust for inflation over 30 years without outliving their funds[cite: 1, 2]. The rule was fundamentally designed around a “worst-case scenario” for American retirees[cite: 1]. Bengen built his 4% guideline around the hypothetical example of a person retiring in 1968 at a stock market peak, right before facing a protracted recession and the high inflation environments of the 1970s[cite: 1, 2].
However, Bengen’s original formula assumes that a retirement portfolio is split roughly 50/50 between stocks and bonds, relying heavily on historic market return data spanning from 1926 to 1976[cite: 4, 5]. During that specific period, bond interest rates were significantly higher, frequently eclipsing 8%[cite: 4, 5].
Modern analysts challenge this framework. Over time, life expectancies have extended dramatically, meaning that retirement savings may now need to last 35 or even 40 years[cite: 5]. Organizations like Morningstar have shifted away from relying purely on historical data, moving instead toward forward-looking research powered by Monte Carlo stress tests[cite: 5]. In December 2025, Morningstar announced that a highly conservative 3.9% starting safe withdrawal rate is optimal for individuals retiring in 2026[cite: 5].
The Flaw of Linear Assumptions in Early Retirement
Both Bengen’s historical research and Morningstar’s forward-looking 3.9% metric[cite: 5] share a critical vulnerability when applied to early retirees. They assume that spending habits remain consistently linear across an arbitrary 30-year horizon[cite: 2].
A flat 4% rule calculation expects a retiree to withdraw a constant, inflation-adjusted percentage from a fixed portfolio for three consecutive decades. Applying this rigid constraint to Henry and Rachel completely misdiagnoses their financial reality because their cash flow requirement is profoundly asymmetric.
Henry and Rachel are retiring at ages 58 and 53, respectively. Their retirement timeline is not a flat, 30-year line. It is cleanly severed into two entirely different financial environments.
The Asymmetric Two-Phase Cash Flow Reality
To map out a viable early retirement, the Collins family must split their planning horizon into two distinct phases.
| Planning Variable | Phase 1: The Bridge Gap | Phase 2: Sustained Phase |
| Time Horizon | Ages 58 to 66 (9 Years) | Age 67 to 95+ (28+ Years) |
| Gross Living Requirement | $105,000 / year | $105,000 / year |
| Guaranteed Social Security Income | $0 / year | $67,500 / year |
| Net Portfolio Draw Requirement | $105,000 / year | $37,500 / year |
| Effective Draw Rate (on $1.1M base) | 9.55% | 3.41% |
During the nine-year Bridge Gap period, Henry and Rachel have zero earned income and are not yet claiming Social Security. Their portfolio must shoulder 100% of their living expenses, creating the intimidating 9.55% requirement.
The Social Security Relief Valve
The entire financial picture shifts at age 67. Once Henry and Rachel claim their Social Security benefits, guaranteed government income covers a staggering 64.2% of their total annual living budget.
This event drops their required portfolio draw from a dangerous $105,000 down to a highly manageable $37,500 per year. When you divide a $37,500 draw by their original $1.1 million asset base, it results in a 3.41% withdrawal rate.
A 3.41% withdrawal requirement sits well below Morningstar’s 3.9% safe starting target for 2026. It also falls deeply underneath the 4.7% updated safe withdrawal rate that William Bengen recently recommended for modern retirees maintaining higher equity allocations[cite: 2, 5].
Shifting the Financial Goalpost
The realization that their long-term draw drops to 3.41% completely rewrites the Collins family’s retirement objective.
They do not need their $1.1 million portfolio to perpetually generate $105,000 in compounding cash for the rest of their lives. Their primary planning hurdle is isolated strictly to the 9-year bridge period. They simply need to survive the gap between age 58 and age 67 without severely liquidating their principal.
To safely cross this bridge, early retirees cannot rely on simple division or static calculators. They must utilize advanced probability modeling to ensure their capital base survives potential bear markets during those highly vulnerable early years.
Coming Up Next Week in Part 3…
Does the Collins family have enough cash reserves to protect their equities if the market crashes the day after Henry retires? Next week, we will run a 10,000-scenario Monte Carlo simulation to stress-test their $1.1M portfolio against bear markets, inflation shocks, and the realities of sequence of return risk.
Important Disclosures: Retirement “R” Us, a registered retirement planning advisor, provides this information for educational purposes only. It is not intended to offer personalized investment advice or suggest that any discussed securities or services are suitable for any specific investor. Readers should not rely solely on the information provided here when making investment decisions.
- Investing carries risks, including the potential loss of principal. No investment strategy can ensure a profit or protect against loss during market downturns.
- Past performance is not indicative of future results.
- The opinions shared are not meant to serve as investment advice or to predict future performance.
- While we believe the information provided is reliable, we do not guarantee its accuracy or completeness.
- This content is for educational purposes only and is not intended as personalized advice or a guarantee of achieving specific results. Consult your tax and financial advisors before implementing any discussed strategies.
- Everyone’s retirement circumstances, especially when it comes to health insurance and health care, are unique.
- Retirement “R” Us does not provide tax or legal advice. Please consult your tax advisor or attorney for advice tailored to your situation.
Legal Disclaimer: The information provided on this website is for general informational purposes only and is not intended to be legal advice. While we strive to ensure the accuracy and completeness of the information, we make no guarantees regarding its accuracy, completeness, or timeliness. The content is provided “as is” without any warranties of any kind, either express or implied.
Use of this website does not create an attorney-client relationship between the user and the website owner or any of its contributors. Users should not act upon the information provided without seeking professional legal counsel. Any reliance on the information provided is solely at the user’s own risk.
We are not responsible for any errors or omissions, or for any actions taken based on the information provided on this website. Links to third-party websites are provided for convenience only and do not constitute an endorsement or approval of their content. We are not liable for any damages arising from the use of or reliance on the information provided on this website or any linked third-party websites.
By using this website, you agree to the terms of this legal disclaimer. If you do not agree with these terms, please do not use this website.
Leave a Reply